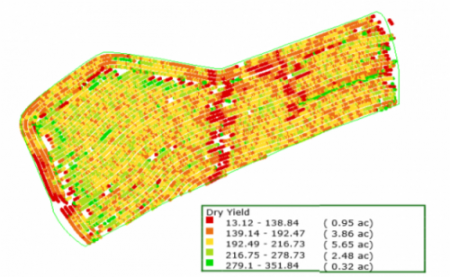
Above is a yield map of a 14 acre field from a farm that started to use data in their decision making a few years ago. After collecting yield data from both corn and soybeans as well as soil data from grid sampling, we have been able to map out the difference of production capability on each acre of the farm, including this field. Data can help us increase profits on any field, whether it’s a smaller 14 acres field like this one or a 40, 80, or 200 acre field.
For this example, let’s assume this field is corn in 2016, and the cost of inputs were $280 per acre. By establishing grass strips (waterways), this grower was able to eliminate the poorest yielding areas, which were almost an acre. That would reduce the area needing inputs by 7%, and in this map would change his average from 196 bushel per harvested acre to 210 bushel per acre. The savings of inputs in this case gains the farmer an additional $5.00 per acre profit. The poor yielding areas consistently yielded less than enough to cover the cost of inputs, so even if this is rented ground, this grower increases overall profit by eliminating those areas or reducing overall inputs.
The data from this field also shows us areas we could increase production through better application of nutrients. The west part of the field was the highest yielding but also had the best organic matter and CEC numbers on the soil test. In-season tissue test, nitrate test, and weather data showed us evidence of yield increase from a sidedress application. Variable rate applications along with proper timing of those applications helped us increase yield on the medium performing areas for even greater profits.
The goal of using technology and data is ultimately to increase overall profit. This can come from any combination of increasing yield, increasing inputs, or decreasing inputs. When we have better data we can make better decisions about the needs of our crops, and better decisions lead to greater profit.
Thank you, Andrew Tucker